
AI Email Analytics: Measuring ROI of Your Twirly AI Campaigns
Jul 3, 2025
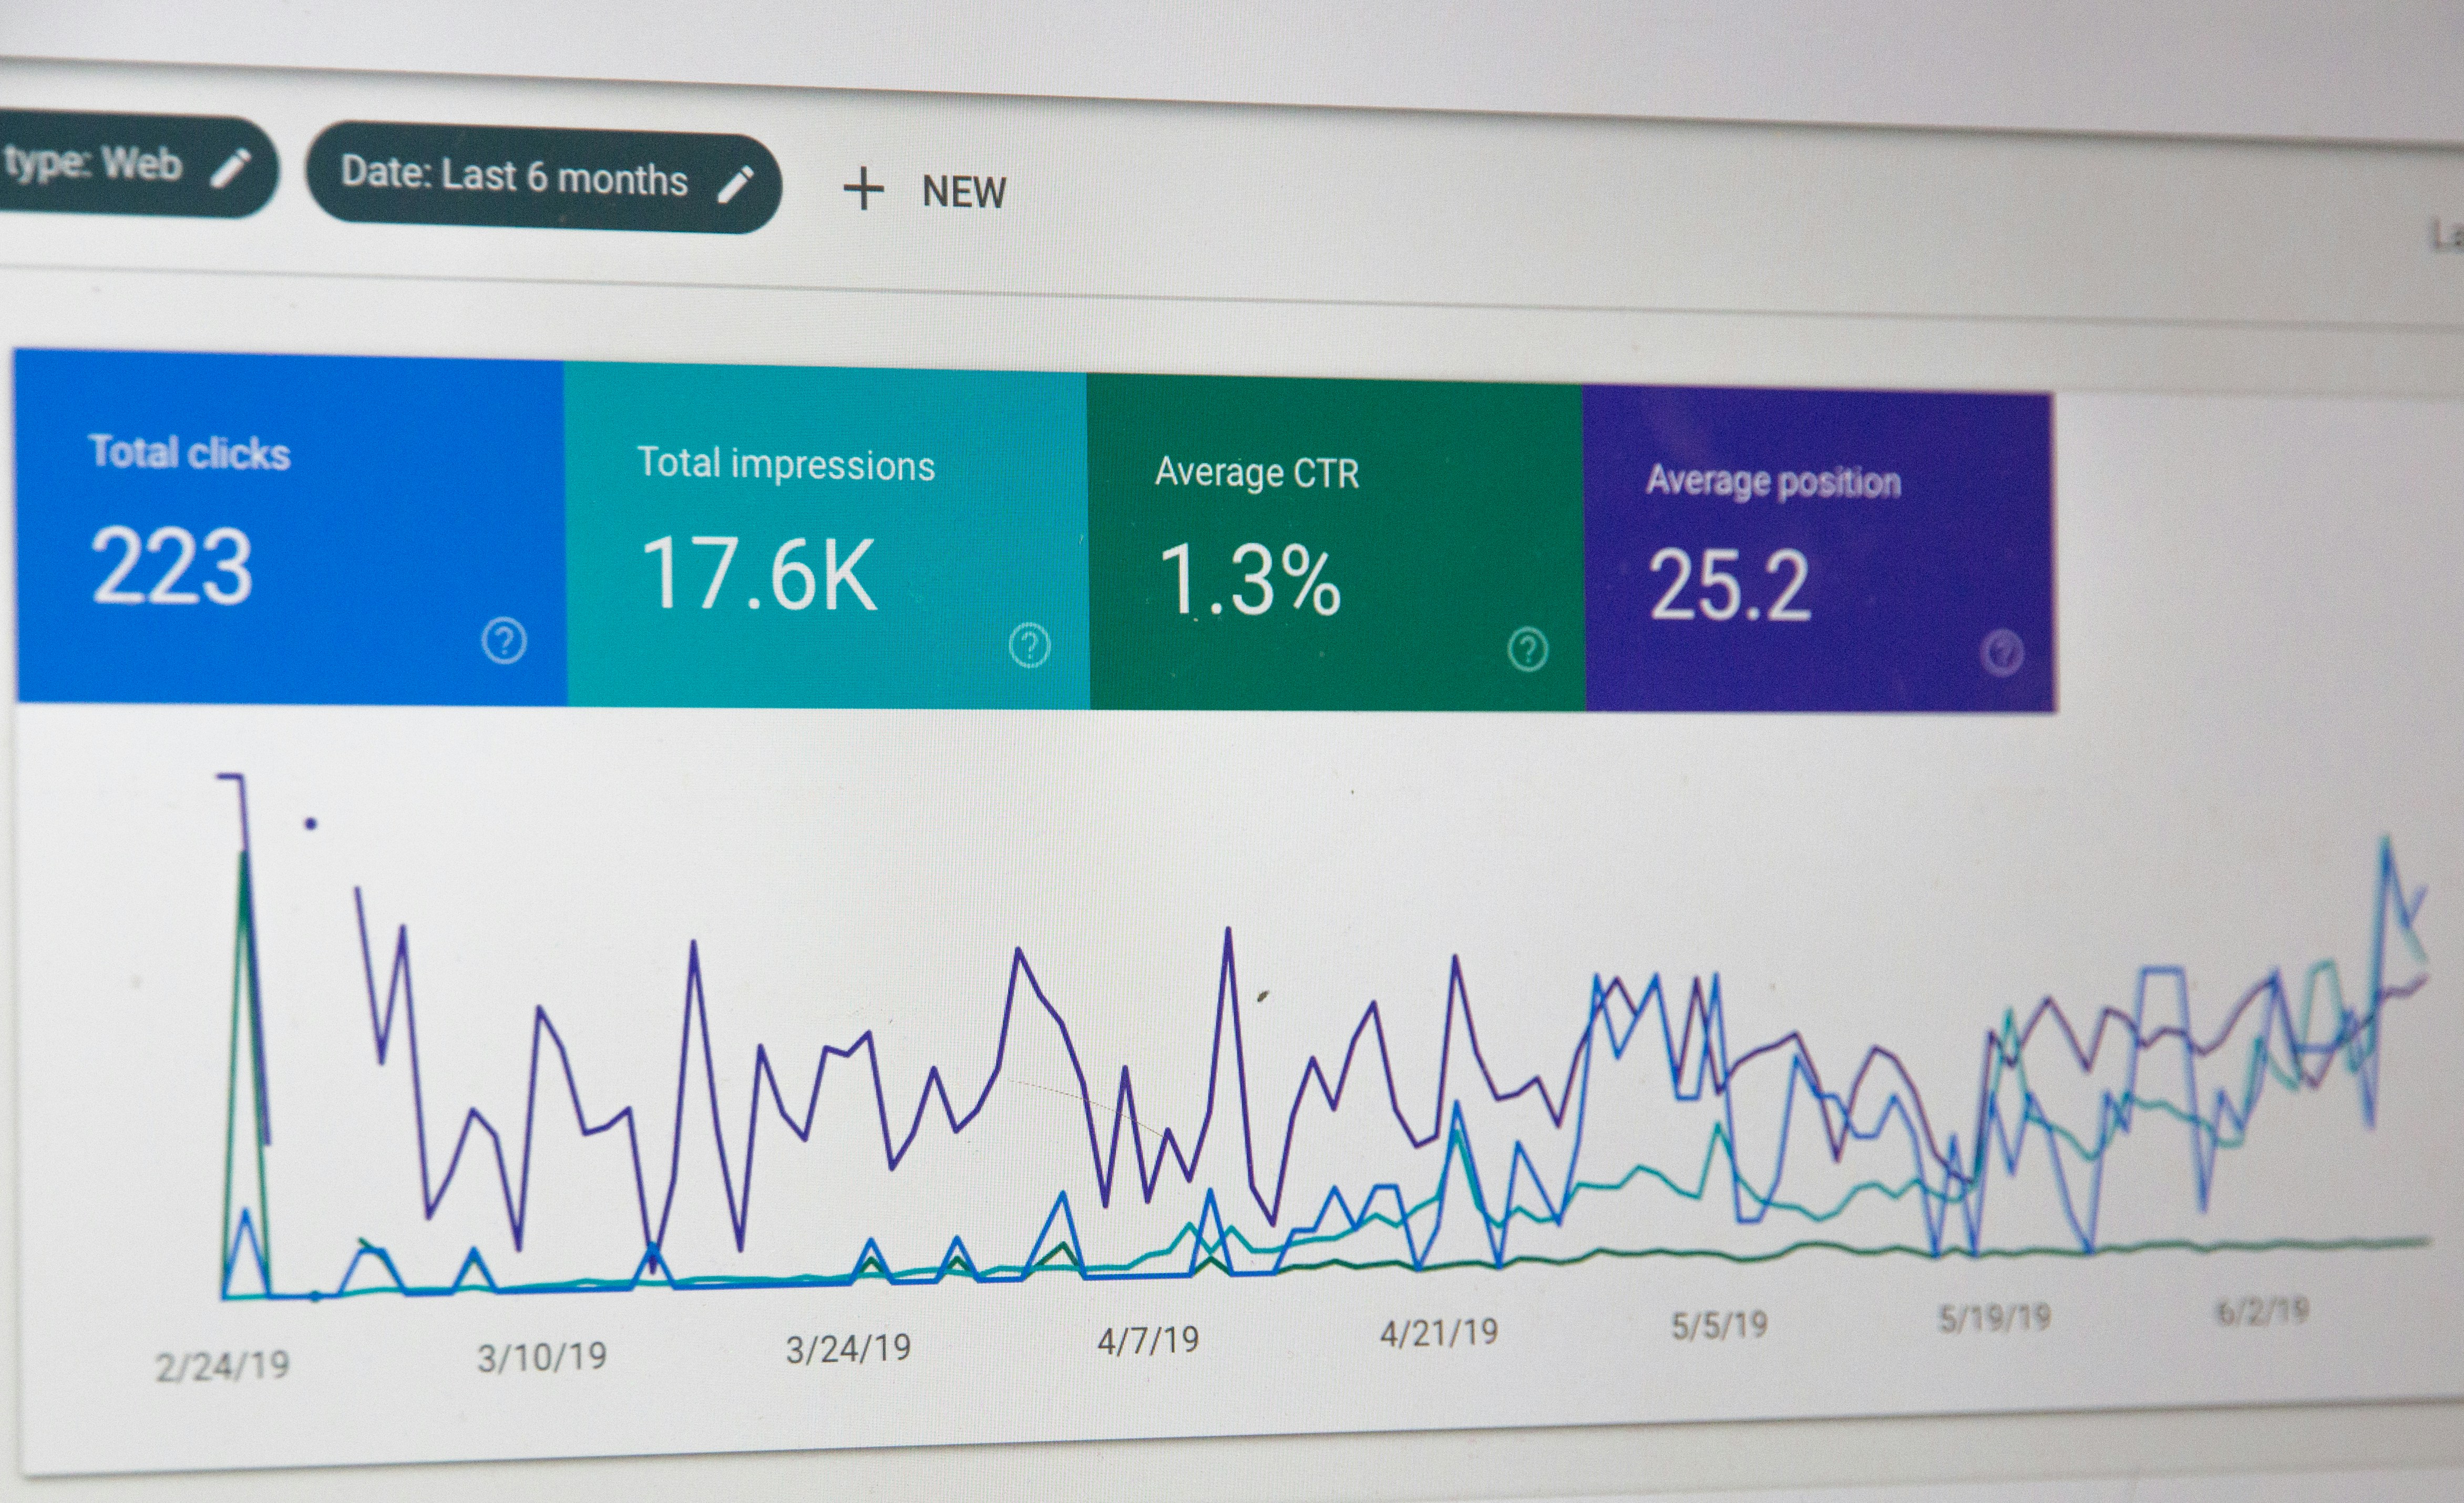
Data-driven decisions power winning campaigns. Twirly AI’s analytics dashboard helps you track performance metrics—from opens to revenue—so you can calculate true ROI and optimize your tactics.
Key Metrics to Track in Twirly AI
Open Rate, Click-Through Rate, and Reply Rate
Open Rate: % of recipients who open your email.
CTR: % clicking at least one link.
Reply Rate: % replying to the email.
Revenue per Email and Campaign ROI
Set up revenue attribution by linking Twirly to your payment platform.
Calculate ROI:
(Revenue - Cost) / Cost * 100%.
Setting Up Custom Dashboards
Creating Widgets for Each KPI
Go to Analytics → Dashboard and click Add Widget.
Scheduling Automated PDF Reports
Under Reports → Schedule, set daily/weekly email summaries.
Attribution Models for Email Revenue
First-Touch vs. Last-Touch
First-Touch: credit first email opened.
Last-Touch: credit last email clicked before purchase.
Configuring in Twirly Analytics
Select attribution model in Settings → Attribution.
Analyzing Engagement Heatmaps
Heatmap of Click Hotspots
View which links get the most clicks visually.
Refining Copy Based on Data
Move high-performing CTAs higher in the email.
Actionable Insights & Optimization
Identifying Underperforming Segments
Filter by demographics, device, or geography.
Iterating Subject Lines and Content
Use A/B test results to swap in winning variants.
Next Steps: Dive into your Twirly Analytics dashboard. Set up custom widgets, schedule reports, and start optimizing based on real ROI data.